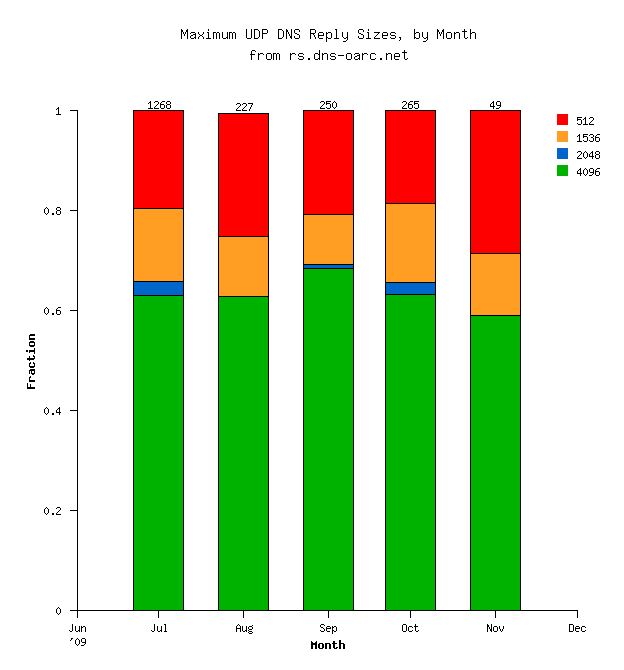
A couple months ago I posted some data from the OARC reply size test service. Recently some folks have been wondering if the situation is getting better or staying the same. Today I created a graph that shows the monthly trend:
The data probably does not contain enough samples to ascertain any trends. The number of samples in each month is shown at the top of the bars. Also keep in mind that this data has a self-selecting bias. We're only measuring resolvers of people that choose to use this service.